T-SIM V4.5 Reference
Post-processing
There are several ways how to open a project for post-processing:
Once the project is opened for post-processing, the following operations are accessible:
There are three ways of refinement in post-processing.
Manual refinement 1:
This refinement works like the refinement
of flat sheet in T-SIM Grid view:
Click Grid(sheet) / Refine to refine the sheet inside a selected rectangular
area. Then move the cursor into a required position and press and hold
down the left mouse button. Move the cursor to the second corner of
the rectangle and release the mouse button. The deformed sheet is automatically
refined. This method can be repeated until the required grid density
is obtained.
Manual
refinement 2:
This refinement works in a different way. Elements for refinement
can be selected / unselected repeatedly using post-processing
toolbar.
Elements selection:
Click on the icon with the tool tip "Select elements". Then move the cursor into a required position and press and hold down the left mouse button. Move the cursor to the second corner of the rectangle and release the mouse button. Elements inside the rectangle will be selected (their edges color will change to green).
Elements unselection:
1) Click on the icon with the tool tip "Unselect elements". Then move the cursor into a required position and press and hold down the left mouse button. Move the cursor to the second corner of the rectangle and release the mouse button. Elements inside the rectangle will be unselected (their edges color (green) will change to white).
2) Click on the icon with the tool tip "Unselect all". All elements will be unselected.Elements selection using picking:
Click on the icon with the tool tip "Toggle elements picking on / off". Move the cursor above an element, press Control key and click the right mouse button. The element will be selected. Also any already selected element can be unselected this way.
Refinement:
When elements for the refinement are selected, click on the icon with the tool tip "Refine selection". The selected elements of the deformed sheet will be automatically refined. This method can be repeated until the required grid density is obtained.
Automatic refinement:
This refinement automatically refines the most deformed elements.
Click on Grid (sheet) / Automatic refinement to refine the deformed
sheet. This method can also be repeated.
The refined sheet can be saved using command Grid(sheet) / Save as *.bcs.
Export for structural analysis
The submenu Grid(sheet) / Export for structural analysis
enables to export thermoformed product geometry, thickness and temperature
to several formats ( DXF, IGES, Patran, Cosmos / M). The exported files
can be used for structural analysis.
Ansys Out creates two files directly readable by ANSYS. One file exported contains geometry and thickness profile data. The second file contains residual stresses.
DXF Out creates a text file consisting of Autocad entities called 3DFACE. Such a DXF file can be used in Autocad or other CAD packages to visualize post-processing results. The file exported does not contain any information about thickness or temperature.
IGES Out creates a text file consisting of two spline surfaces. The first surface describes upper part of the product, second spline surface gives the lower part. Distance between these two surfaces is given by thickness of a thermoformed product. Such an IGES file can be used for consecutive post-processing with other CAD packages, mainly for static analysis of thermoformed product.
Cosmos/M Out creates a file directly readable by COSMOS / M structural analysis program. The file exported contains only thickness information. Temperatures are not exported.
Patran Out creates five files - *.out, *.nod, *.tep, *.elm and *.fin in PATRAN format.
Map to LS-Dyna creates an LS-Dyna file based on a "template file" (LS-Dyna file without thickness information). The new LS-Dyna file contains the same information as the "template file" with nodal thickness values added. Projected and original LS-Dyna nodes are displayed once the mapping process is finished. The original nodes are in white and the projected nodes are in pink color.
Starting with T-SIM V4.31, calculation of weight of selected areas of deformed grid (sheet) is possible. This feature offers much more straightforward way to analyze the final product properties than the old Trim line feature.
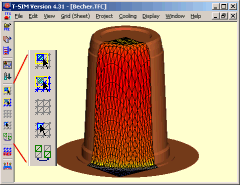
Having a solved project open for post-processing, use the toolbar on the left side of the post-processing window to select element to be included in weight calculation.
 |
The first button
enables to select a rectangular area of elements, the second button
enables to unselect elements within rectangular area. Third button
unselects all. The next button toggles element picking on and off.
The last button inverts the selection. |
How to select elements:
Elements selection:
Click on the icon with the tool tip "Select elements". Then move the cursor into a required position and press and hold down the left mouse button. Move the cursor to the second corner of the rectangle and release the mouse button. Elements inside the rectangle will be selected (their edges color will change to green).
Elements unselection:
1) Click on the icon with the tool tip "Unselect elements". Then move the cursor into a required position and press and hold down the left mouse button. Move the cursor to the second corner of the rectangle and release the mouse button. Elements inside the rectangle will be unselected (their edges color (green) will change to white).
2) Click on the icon with the tool tip "Unselect all". All elements will be unselected.
Inverting selection:
To invert selection, click on the icon with the tool tip "Invert selection"
Elements selection using picking:
Click on the icon with the tool tip "Toggle elements picking on / off". Move the cursor above an element, press Control key and click the right mouse button. The element will be selected. Also any already selected element can be unselected this way.
Having elements selected, click on Grid / Properties in post-processing menu. The following window appears with details about selected area:

This window is modeless, this means you still can continue in elements selection / unselection. Information about volume and weight is updated automatically.
Trimmed part weight calculation - using TrimLine
The following commands are accessible from Grid (Sheet) / Trim line menu:
The loaded trim line is superposed onto the sheet and the mass of the selected part of the sheet is calculated.
Format of Trim Line file (*.CDL):
The trim line must be described as a set of points stored in CADL format
(CadKey). Units used in CADL file can be millimeters or inches (see
Configuration).
Preparing data to describe a Trim
Line:
T-SIM is capable to read a set of 3D-points from files in CADL-format.
Example - How to create a trim line
representation in SURFCAM (CAD - Surface modeler):
The trim line must be one continuous NURB spline. It is necessary to
create the set of points on this spline. To do so, one has to copy the
spline into separate layer. Then select INCREMENT command in EDIT menu.
Select the spline representing the trim line. Fill the dialog like this:
Then the points representing the trim line are created. Now go to FILE menu and click CADL. Then select WRITE. Enter a filename to save the data.
Remark: When exporting to CADL, only the layer containing the set of points representing the trim line should be active.
In T-SIM: Open a solved project in post-processing. Select command Load trim line from Grid (Sheet) / Trim line menu. Enter the name of the CADL file previously created in SurfCam. The trim line is loaded and volume etc. of the selected part is calculated.
Format of CADL file containing Trim
Line data:
Each line in the file looks like this:
POINT 10.0, 0.0, 0.0 ...
(POINT is a keyword saying that the three following coordinates
represent a 3-D point.)
Number of points is not restricted.
Example:
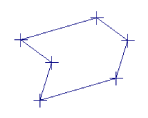
(Trim Line File list - the first point has to be
the same as the last one)
POINT 0,0,0,15,0,0,0,0
POINT 50,0,0,15,0,0,0,0
POINT 50,20,0,15,0,0,0,0
POINT 50,20,20,15,0,0,0,0
POINT 0,20,20,15,0,0,0,0
POINT 0,20,0,15,0,0,0,0
POINT 0,0,0,15,0,0,0,0
(Resulting Trim Line)

When in post processing, use command Cooling / Calculate cooling (located on Post processing toolbar) to calculate the formed part cooling.
Remark: The cooling calculation is possible only when
the project was completely solved using T-SIM Version 4.1 or later.
After clicking the command specify the cooling time and
click OK.
The cooling calculation starts immediately. The temperature map on the
formed product is changing as the grid (sheet) is cooling down. Once
the calculation is finished (the cooling time is reached), the deformed
grid (sheet) has the final cooled temperature profile.
Remark: During the cooling calculation, the temperature scale has fixed limits. To get scale with real temperature minimum and maximum after the calculation, click on Limits button on the Scale bar and select Automatic in the Limits group.
3D cuts
To create the 3D Cut view, use Grid (sheet) / Cut window command
in post-processing.

Use the Make cut button to make a cut on the deformed sheet.
Making a cut:
Once the cut is created, the correspondence between the 2D cut graph and the original 3D picture can be easily found when placing the mouse cursor to the area of 2D curve of thickness(temperature, stress or extension) / arc length. After pressing and keeping pressed the left mouse button, the vertical line appears on the graph and the double lined cross in the 3D picture. When moving the cursor, the cross moves in the 3D space, thus giving a track of a desired position both in 2D and 3D.
The window with the graph can be moved or resized so that it does not hide the area of interest in the 3D picture.
To modify the graph limits, click on Limits.
Use the [T] button to force the cut window to remain on the top. When the button is pressed, the cut window remain on the top.
It is possible to print out the cut graph - use Print command from Cut menu.
3D cut data table
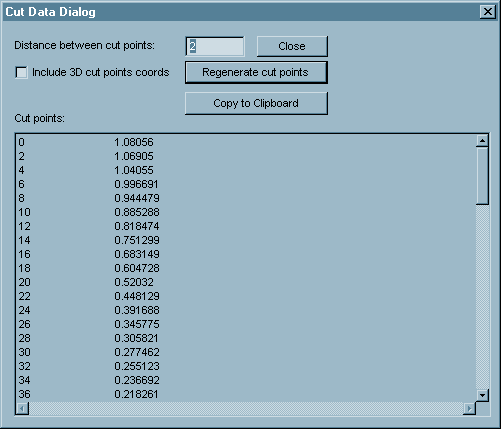
Click on Cut / Cut data table when T-SIM Cut view is active to display the following dialog:

This dialog contains data of a cut created from 3D cut view.
In Distance between cut points specify a positive value in mm / inch and press Enter key or click on Regenerate cut points. Cut points will be recalculated.
To include 3D coordinates of the cut points into the cut data, check Include 3D cut points coords.
Click on Copy to clipboard to copy the cut data into clipboard. These data stored in clipboard can be used for transfer into MS Excel etc.
Click Close to close the dialog.
Export - video, bitmap, VRML, HTML + VRML
Display / Export / Video
This command creates AVI (Audio-Video-Interleaved) file - animation
of post-processing results. Starting from T-SIM Version 4.5, it is possible to specify the video codec for export. Moreover, frames for export can be selected. For more inormation see Exporting video from T-SIM.
Display / Export / Bitmap
This command creates BMP file - a bitmap with post-processing results.
After selecting it, specify a file name to save the picture into. Then
specify required bitmap resolution an click OK. 24-bit bitmap is created
and saved under the specified name.
Display / Export / VRML
This command creates VRML file - a 3D representation of the actual post-processing
results. After selecting it, specify a file name to save the VRML data
into and click OK. VRML file is created automatically. A VRML viewer
is necessary to open the VRML file.
Display / Export / HTML (VRML+scale)
This command creates HTML file containing embeded VRML model and PNG
color scale of the actual post-processing results. After selecting it,
specify a file name to save the HTML code into and click OK. HTML file
with the specified name is created. Moreover, a VRML file with the same
name as the HTML file, but with extension "wrl" is created,
containing 3D VRML model data of the deformed sheet. The corresponding
variable color scale is saved into a PNG file, having also the same
name as the HTML (with extension PNG). Any existing HTML / VRML / PNG
file(s) are overwritten.
The created HTML file can be opened in any HTML browser. A 3D VRML viewer plug-in has to be installed in order to display the VRML model on HTML page. On this page, a list of VRML viewers is available. Accuform recommends the following VRML viewers: CosmoPlayer and WorldView.
Animation
Command Display / Animation runs and stops animation of post-processing results.
This very useful feature enables the T-SIM user to exchange results. The exported files keep all the information needed to rerun a project, no additional information is needed. After exporting results, the files can be compressed and sent as an attachment to E-mail message. It became an important and very efficient tool in supporting T-SIM customers worldwide.
(It is not necessary to export all the files, namely the calculated (*.000, *.001, *.0..). They are usually too big to be sent via Internet. As a default, they are excluded from the exporting routine. If you wish to export also result files, simply uncheck Export only source project files. Moreover, it is possible to export just first and last records - just check Export FL …).
In post-processing, click Project / Export results. The following dialog appears:

In Export to folder enter a folder name or use Browse
button to browse for a folder to export the projects files into. If
the specified folder does not exists the program will offer to the user
to create one of this name. Click Export to export all project files
into the specified folder. Click Close to close the export dialog.
Project information
With a T-SIM project open for post processing, click on Project
/ Project info to display the following information box:

It gives information about the files used in project,
job number, number and programmer.
Remark: To access the source project directly (to open any of the project
files etc.), click on Project / Open source project file.
Record information
With a T-SIM project open for post processing, click on Project
/ Record info to display the following information box:

It gives information about the active record number, inflated grid outer box dimensions, the time of the process until the active record, the pressure achieved and the inflated volume.
The average thickness value is calculated from the grid
elements which are not clamped.
Thickness non-uniformity factor is defined below.
Thickness non-uniformity factor:
![]()
Average thickness:
![]()
S … deformed sheet area
se … deformed element area
te … deformed element thickness
Grid properties
With a T-SIM project open for post processing, click on Grid / Properties to display the following information box:

It gives information about the number of elements (triangles), the dimensions of the deformed grid, mean thickness (for the whole grid and for the grid excluding clamped elements) and mean temperature.
Critical venting areas analysis
To analyze critical venting areas, open a T-SIM project
for post processing, click on Project / Critical venting areas. The
analysis starts immediately. When it is finished, every element has
one of the following colors:
Red color: The area is not on mold
wall
Yellow color: The area is just touching
mold wall
Blue color::
The area lays on mold wall
To analyze how the mold is filling and what areas have a critical venting condition, explore different simulation records. To terminate the critical venting areas analysis, click on Project / Critical venting areas.
Initial temperature profile optimization
T-SIM is capable to automatically optimize the initial sheet temperature in order to get uniform thickness distribution on a final product. First, open a solved project for post-processing. Now, select the command Grid / Optimize thickness.
T-SIM asks for limits for temperature (minimal and maximal temperature
required on the inital sheet before forming). Enter the values. For
example, when average sheet tempeature is 150°C, put minimun 135°C
and maximum 165°C.
T-SIM creates a new subdirectory "OptimThickness" and in this
directory, new optimization projects are automatically generated. Once
T-SIM is prepared to start the optimization, the following message box
appears together with the optimization batch view:

Now click OK to start the optimization batch solution. Another message box asking for confirmation appears. Click Yes and the optimization will start. Ten optimization projects will be solved to get the optimized initial sheet temperature profile. Please wait until the optimization batch is solved. This can take a long time, especially in case the solution of the initial project took more than tens of minutes. Once the optimization is finished:
Boundary conditions - modification
Having a solved project open for post-processing, use the toolbar on the left side of the post-processing window to select elements and to modify the boundary conditions on their nodes.
First, select the elements for modification (details about elements
selection can be found in the section about Part
weight calculation). Having elements selected, any of the following
actions can be performed:
Add clamping
Remove clamping
Add "no pressure" flag
Remove"no pressure" flag
Clicking on button associated with one of the actions described about immediatelly add/remove clamping/"no pressure" flags to/from the selected elements.
When in post-processing, Analyze / Element history command enables advanced analysis of deformation, stress and temperature history of selected element(s).
Having a solved project open for post-processing, use the toolbar on the left side of the post-processing window to select at least one element. Now click Analyze / Element history.
Element history data are automatically copied to Clipboard. Use Copy/Paste command to put the data into your favourite spreadsheet software to create graphs showing dependency of deformation on time, stress on time, stress on deformaiton etc.
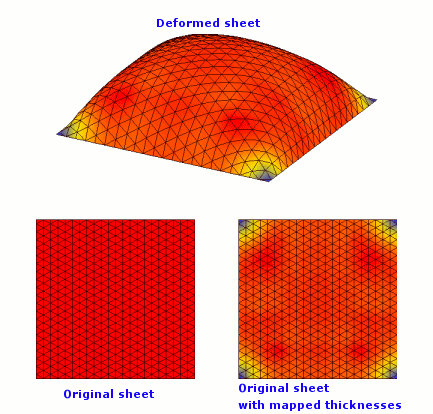
Having selected any record in post-processing, Grid / Export actual thickness map command enables to save the actual elements thicknesses as a T-SIM sheet file (*.bcs). Original (not deformed) sheet geometry is used and the actual elements thicknesses are copyied to the original grid. The result is save into a file having a user's specified name:

Export deformed sheet upper and lower surface as STL
Having selected any record in post-processing, Grid / Save to STL command can be used to export the actual sheet upper and lower surface to STL files with names name_upper.stl and name_lower.stl, where 'name' is a file name specified by the user. Sheet elements are represented by STL triangles.