

B-SIM V2.5 Reference - Blow molding simulation

Display and configuration
This document contains information about:
Rotation, zooming, panning
Zooming operations can be invoked from the Scale toolbar.
To zoom in using mouse, press Ctrl + Shift, hold it and move the mouse with the left button pressed. Release the mouse button to stop zooming in / out. Having a mouse with the scrolling wheel, rotate the wheel to zoom in / out.
Rotation - press the left mouse button, hold it down and drag the mouse. Release the mouse button for scene repaint. (Rotation can be also performed using the cube on the Scale toolbar . Use the same method to rotate the cube. Once the mouse button is released, the scene is repainted in a new position.)
Selecting center of rotation - with Control button pressed, click the left mouse button on preform / parison or tool. The point clicked becomes the new center of rotation. Use Zoom Fit to move the center of rotation to the center of scene and window.
Panning - press the right mouse button, hold it down and drag the mouse. Release the mouse button for scene repaint.
Nodes and their boundary conditions
B-SIM allows to display nodes with different boundary conditions using different colors. Also nodes in contact with different tools can be displayed. The following table shows node types displayed in B-SIM:
| Fixed nodes | These nodes are fully fixed and they cannot move during the process simulation. The "fixed" flag can be removed - see FEM grid - boundary conditions removal. |
| Clamped nodes | These nodes are fully fixed and they cannot move during the process simulation. However, clamping can be removed for every clamped node in B-SIM Grid view. |
| Boundary nodes |
Nodes connected with one or two boundary condition(s) - planes. |
| No Pressure nodes |
Pressure is not applied on elements with all three nodes with the "no pressure" flag. |
| Contact nodes | These nodes are in contact with a tool. |
For information how to switch visualization of different nodes on and off, and how to modify nodes colors, see Display options.
Preform / parison profiles
Using Scale toolbar, different profiles can be displayed on preform / parison:
- Material - distribution of material groups
- Thickness profile - thickness profile of the preform / parison.
- Temperature profile - temperature profile of the preform / parison
- Stress von Mises - von Mises stresses. The von Mises stress is computed from the principal stresses as follows: Sigma = SQRT({0.5[(P1-P2)^2 + (P2-P3)^2 +(P3-P1)^2 ]} SQRT refers to square root and ^ refers to the power.
-
Planar extension - planar extension profile. Planar extension is an average
extension expressed by extensions in principal direction:
lambda planar = SQRT ( lambda1 * lambda2)
SQRT refers to square root. -
L1 / L2 - ratio of relative extensions in two principal directions (1 and 2)
L1/L2 = 1 means deformation is equibiaxial.
L1/L2 >> 1 means deformation is almost uniaxial.
For every displayed profile, its limits can be set using Scale limits dialog.
Scale limits
To set limits for displayed parison / preform profile, click on Limits button on Scale toolbar. The following dialog appears:
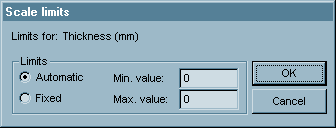
Select Automatic or Fixed.
When Fixed is selected, the scale is kept fixed with limits specified in Min.
and Max. value.
When Automatic is selected, B-SIM calculates minimum and maximum on the preform
/ parison and uses these values as minimum and maximum for the scale.
Click OK to confirm changes.
Remark: Scale limits can be specified for any profile (thickness, temperature, stress, extensions...).
Mouse position tracking (element, node, 3D point info)
The automatic mouse position tracking enables to display information about nodes / elements / 3D points in the location where the mouse points.
To switch on the automatic mouse tracking, use B-SIM messages bar - check the small button with the following icon (the icon tool tip is "Item info on / off"):

Now, move the mouse cursor to point on preform / parison or tool. On the B-SIM messages bar, information about the node / element / 3D point under the mouse cursor is displayed:

The type of information displayed depends on the item under cursor (parison / preform or tool), and also on the Shift + Right mouse button function selected in the Scale toolbar:
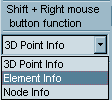
Click on the combo box with title "Shift + Right mouse button function" and select one of the possible functions.
- 3D Point Info - display 3D coordinates of the point under the mouse cursor
- Element info - display information about parison / preform or tool elements
- Node info - display information about parison / preform or tool nodes
There are several toolbars and bars in B-SIM enabling to perform various operation, start various tasks, display information boxes, cut windows etc. Every toolbar can be switched on and off using the View menu (this menu is accessible for every document type). For more information, select a toolbar type:
- Standard toolbar - contains standard command + display option shortcuts
- Status bar - standard Windows-type status bar
- Scale toolbar - toolbar for zooming, rotation, displayed parison / preform profile selection etc.
- B-SIM shortcuts bar - toolbar with shortcuts for creation / opening B-SIM documents
- B-SIM messages bar - bar with B-SIM messages and mouse tracking info
- Post-processing record bar - bar for selection of the active record (post-processing only)
- Post-processing toolbar - toolbar with shortcuts for various task (post-processing only)
- Image manager toolbar - toolbar for image distortion / pre-distortion (image manager is an option)
- Solver bar - bar with command enabling to run / pause / stop solver
- Solver info bar - bar displaying progress of process simulation (Solver only)
Standard toolbar
This toolbar is displayed at the top of B-SIM window. Its status depends on the active window (namely on the document type displayed in the active window).
The first three buttons enable to create a new document, to open an existing document, and to save the active document:
![]()
The next three buttons enable to cut, copy and paste using Windows clipboard:
![]()
The button with small printer enables to print the active document:
![]()
The following buttons switch on and off displaying of preform / parison, tool 1 and tool 2:
![]()
The next three buttons enable to display the parison / preform as elements with edges, elements without edges, and just edges:
![]()
The following two buttons switch between wire-frame, shaded and shaded + edges display of tool 1 and tool 2:
![]()
The last button switches nodes with boundary conditions visualization on and off:
![]()
Remark: This button does not allow to display the nodes with boundary conditions when all of them are switched off in Display options. In this case, use Display options to switch on some or all of the nodes with boundary conditions.
Scale toolbar
 |
Use this toolbar to: 1. Rotate the displayed sheet and / or tool(s). Press the left mouse button on the cube, hold it down and drag the mouse. Release the button for the scene repaint. 2. Display different profiles on the sheet. Click the arrow in the combo box above the Limits button and select the required profile. 3. Set limits for the color scale. See Color scale limits. 4. Set four basic views - X-Y-Z, X-Y, Y-Z and X-Z. Just click on the corresponding button. 5. Use Zoom Box to zoom into a selected area. Click on this button, move the cursor into a required position and press and hold down the left mouse button. Move the cursor to the second corner of the zoom rectangle and release the mouse button. The picture of the selected area appears immediately on the screen. 6. Use Zoom Box to display the whole picture on the screen. 7. Use Zoom In, Zoom Out to zoom in / zoom out. 8. Use Zoom E-Box to perform exclusive zoom. Click on this button, move the cursor into a required position and press and hold down the left mouse button. Move the cursor to the second corner of the zoom rectangle and release the mouse button. The picture of the selected area appears immediately on the screen - everything outside the selected zoom rectangle is hidden (clipped by clipping planes). To remove the clipping planes, click on Del E-Box. 9. Use Tracking & Shift + RBtn box to select the tracking and Shift + Right mouse button function. For more details see mouse position tracking. |
B-SIM shortcuts bar
This toolbar enables a quick opening / creation of any B-SIM document.
 |
Creates a new grid (parison / preform) Opens an existing grid (parison / preform)
Opens an existing material
Opens an existing batch
|
B-SIM messages bar
This bar displays B-SIM messages stored also in BSLOG.LOG file
located in the B-SIM starting directory.
It also displays information about an item under mouse cursor. The items scanned
are selected using combo box in the Scale toolbar.
- Check
 to force the
messages in the window to scroll automatically.
 - Check
 to display
B-SIM messages.
 - Check
 to enable
Item info mouse tracking. The whole control bar can be switched on / off
using command View / B-SIM Messages on B-SIM main menu.
Post-processing record bar
![]()
When in post-processing, this bar enables to load any record of
the solved project.
Use the buttons << / >> to load the previous / next record or directly specify
the record number in the edit box on the left of the Load button and click Load.
Use the buttons | < / >| to load the first / the last record.
The message on the right side of the Load button informs about
the number of post-processing records.
A record number is valid if it is in the range from 1 to N, where N is the number
of post-processing records.
Post-processing toolbar
|
|
Open the active project for preprocessing Toggle Cut view Refine selected elements |
For more information see Post-processing and
Refinement from post-processing.
Image manager toolbar
This toolbar is used for image distortion / pre-distortion (optional feature of B-SIM). For more information see Images.
Solver bar
This toolbar enables to run, pause and stop B-SIM solver, and to open the active project for post-processing:
|
|
Start solver Open project for post-processing |
Solver info bar
The solver info bar displays information about the progress of the simulation running:
- Ti Time at the current iteration (corresponds with the time used in process control description)
- P rqst Requested pressure in kPa = the pressure which has to be reached at the time Ti
- V infl. Volume of the inflated parison / preform
- Elem Progress of matrix setup for each element. 722 in this case is the total number of elements, 700 is the currently calculated element.
- Progress bar at the bottom of the window shows overall progress of the project solution.
Display options
Display options dialog is accessible from:
- Configuration - click Help / Configuration / Display options. The setting specified here are the defaults for any window which will be opened since the display options are modified.
- The active window when it is Solver or Post-processing - click Display / Display Options. In this case, the settings specified are used for the active window only.
Display option dialog:
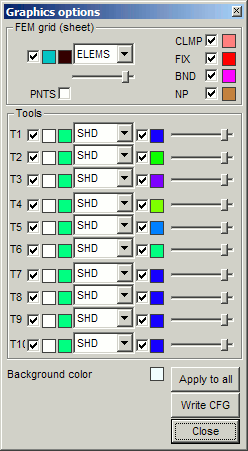
In the section "FEM grid", options for FEM grid displaying are available:

- When Visibility is checked, sheet is be displayed.
- In the combobox Display style, three different ways of sheet displaying can be selected:
Elements + edges - displays sheet as triangles with edges and filled by colors corresponding to selected profile.
Elements only - displays sheet as a shaded 3D surface.
Edges only - displays sheet as a wireframe grid - Color, edges color
To modify the basic color of grid (sheet) and color of grid edges, click in the colored rectangles. Color selection dialog is displayed enabling to change the color. - Clamped, fixed, boundary, no pressure nodes options
Check corresponding check box to make nodes visible. Colors of the nodes can be easily modified - just click on color boxes and change the color in Color selection dialog. Points visibility checkbox enables quick switch of the points (nodes) on and off. - New in B-SIM Version 2.5:
- Transparency - sheet can be transparent. The levev of the transparency can be easily adjusted by dragging the transparency slider .
In the section "Tools", options for tools displaying are accessible:
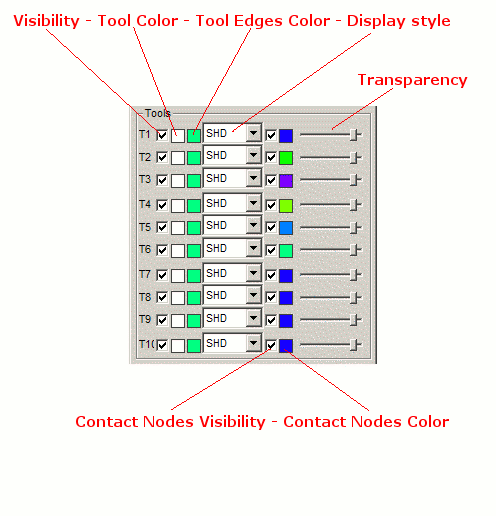
Currently, B-SIM supports at maximum ten independent tools marked as T1 - T10. For all tools, following options can be set:
- When Visibility is checked, the tool is displayed ( is visible).
- In the combobox on the right side of the Display Style checkbox, three different ways of tool displaying can be selected:
Shaded - displays the tool shaded
Wireframe - displays the tool as wireframe.
Shaded + edges - displays the tool shaded with edges of elements
- Tool color, Tool edges color
To modify the basic color of the tool and color of its edges, click in the colored rectangles. Color selection dialog is displayed enabling to change the color. - Contact nodes
Check the check box to make contact nodes visible. Colors of the nodes can be easily modified - just click on color box and change the color in Color selection dialog.Remark: Every tool can have its own basic color, color of edges and color of contact points.
Click Apply to All to apply the actual options to all open T-SIM documents/views.
Click Write CFG to store the actual options to T-SIM configuration.
Click Close to close the window.
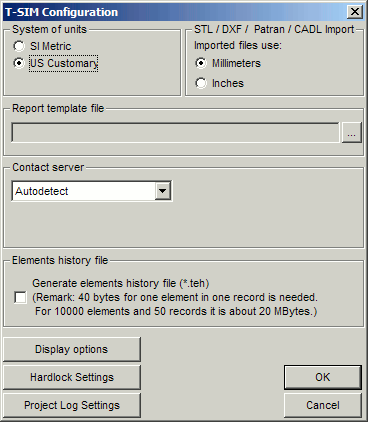
To modify B-SIM configuration, click on Help / Configuration.
System of units:
Select SI Metric to use SI units (mm, °C etc.) while working with B-SIM.
Select US Customary to use US Customary units (inch, °F etc.) while working
with B-SIM.
STL / DXF / Patran / CADL Import:
Select Millimeters if coordinates are stored in millimeters in imported STL
/ DXF / Patran / CDL files.
Select Inches if coordinates are stored in inches in imported STL / DXF /
Patran / CDL files. (It depends on CAD package used for STL / DXF / Patran
/ CDL file creating whether coordinates are in millimeters or inches. B-SIM
needs to know this to ensure correct transformations while translating STL
/ DXF / Patran file into B-SIM internal representation - BCF/PLG file and
while loading a trim line.)
Report template file:
Browse for a report template (HTML) file, which should be used for HTML report
generation. For more details about HTML report, please
see this page.
Contact server:
Use this control to select your license type.
Select 'Local license' when the hardware protection key is connected to the
local PC.
Select 'Network license' when the hardware key is somewhere on the network.
In such case, specify IP address of the PC with the hardware key.
'Autodetect' option is default. T-SIM will try to locate the key automatically.
Display options
This command enables to set up display options.
Hardlock Settings
This command enables activation of various B-SIM features.
Project Log Settings
This command enables to set up options for output of forces acting on tools
during molding process.
Once the configuration is modified , click OK to close the Configuration dialog. Any changes are stored into B-SIM.CFG file.
Hardlock settings
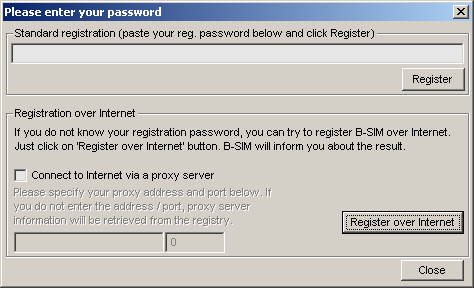
Hardware key dialog, used for version registration, is accessible from Configuration. Click Help / Configuration / Hardlock settings.
Standard registration
If you have obtained a registration password for your version of B-SIM from
Accuform or your local representative, enter the activation password here
and click OK.
Registration over Internet
If you do not have a registration password for your version of B-SIM, you
can try to register B-SIM over Internet. Just click 'Register over Internet'
button and B-SIM will inform you about the result within one minute.
If you are using a proxy server to connect to Internet, check 'Connect to Internet via a proxy server', specify proxy IP address (or name) and proxy port. Then try the registration again. If you are not succesfull, contact Accuform for help.
Remark: B-SIM uses HTTP protocol to contact Accuform registration server. B-SIM does not transfer any information from you computer to Accufom registration server except the hardware key serial number, information about your actual version of B-SIM and your IP address.
Project Log Settings (output of tools forces)
Project log settings dialog enables to switch forces on tools output on and off:
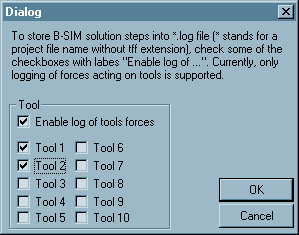
To enable output of forces acting on tools during molding process,
check "Enable log of tools forces".
Then check every tool for which you want the forces acting on it to be written
into a *.log file. "*" stands for project file name without extension.
For example if the project file name is Box.tff, the log file name is Box.log.
The log file is created in the same directory as the project solved during
the project solution.


